

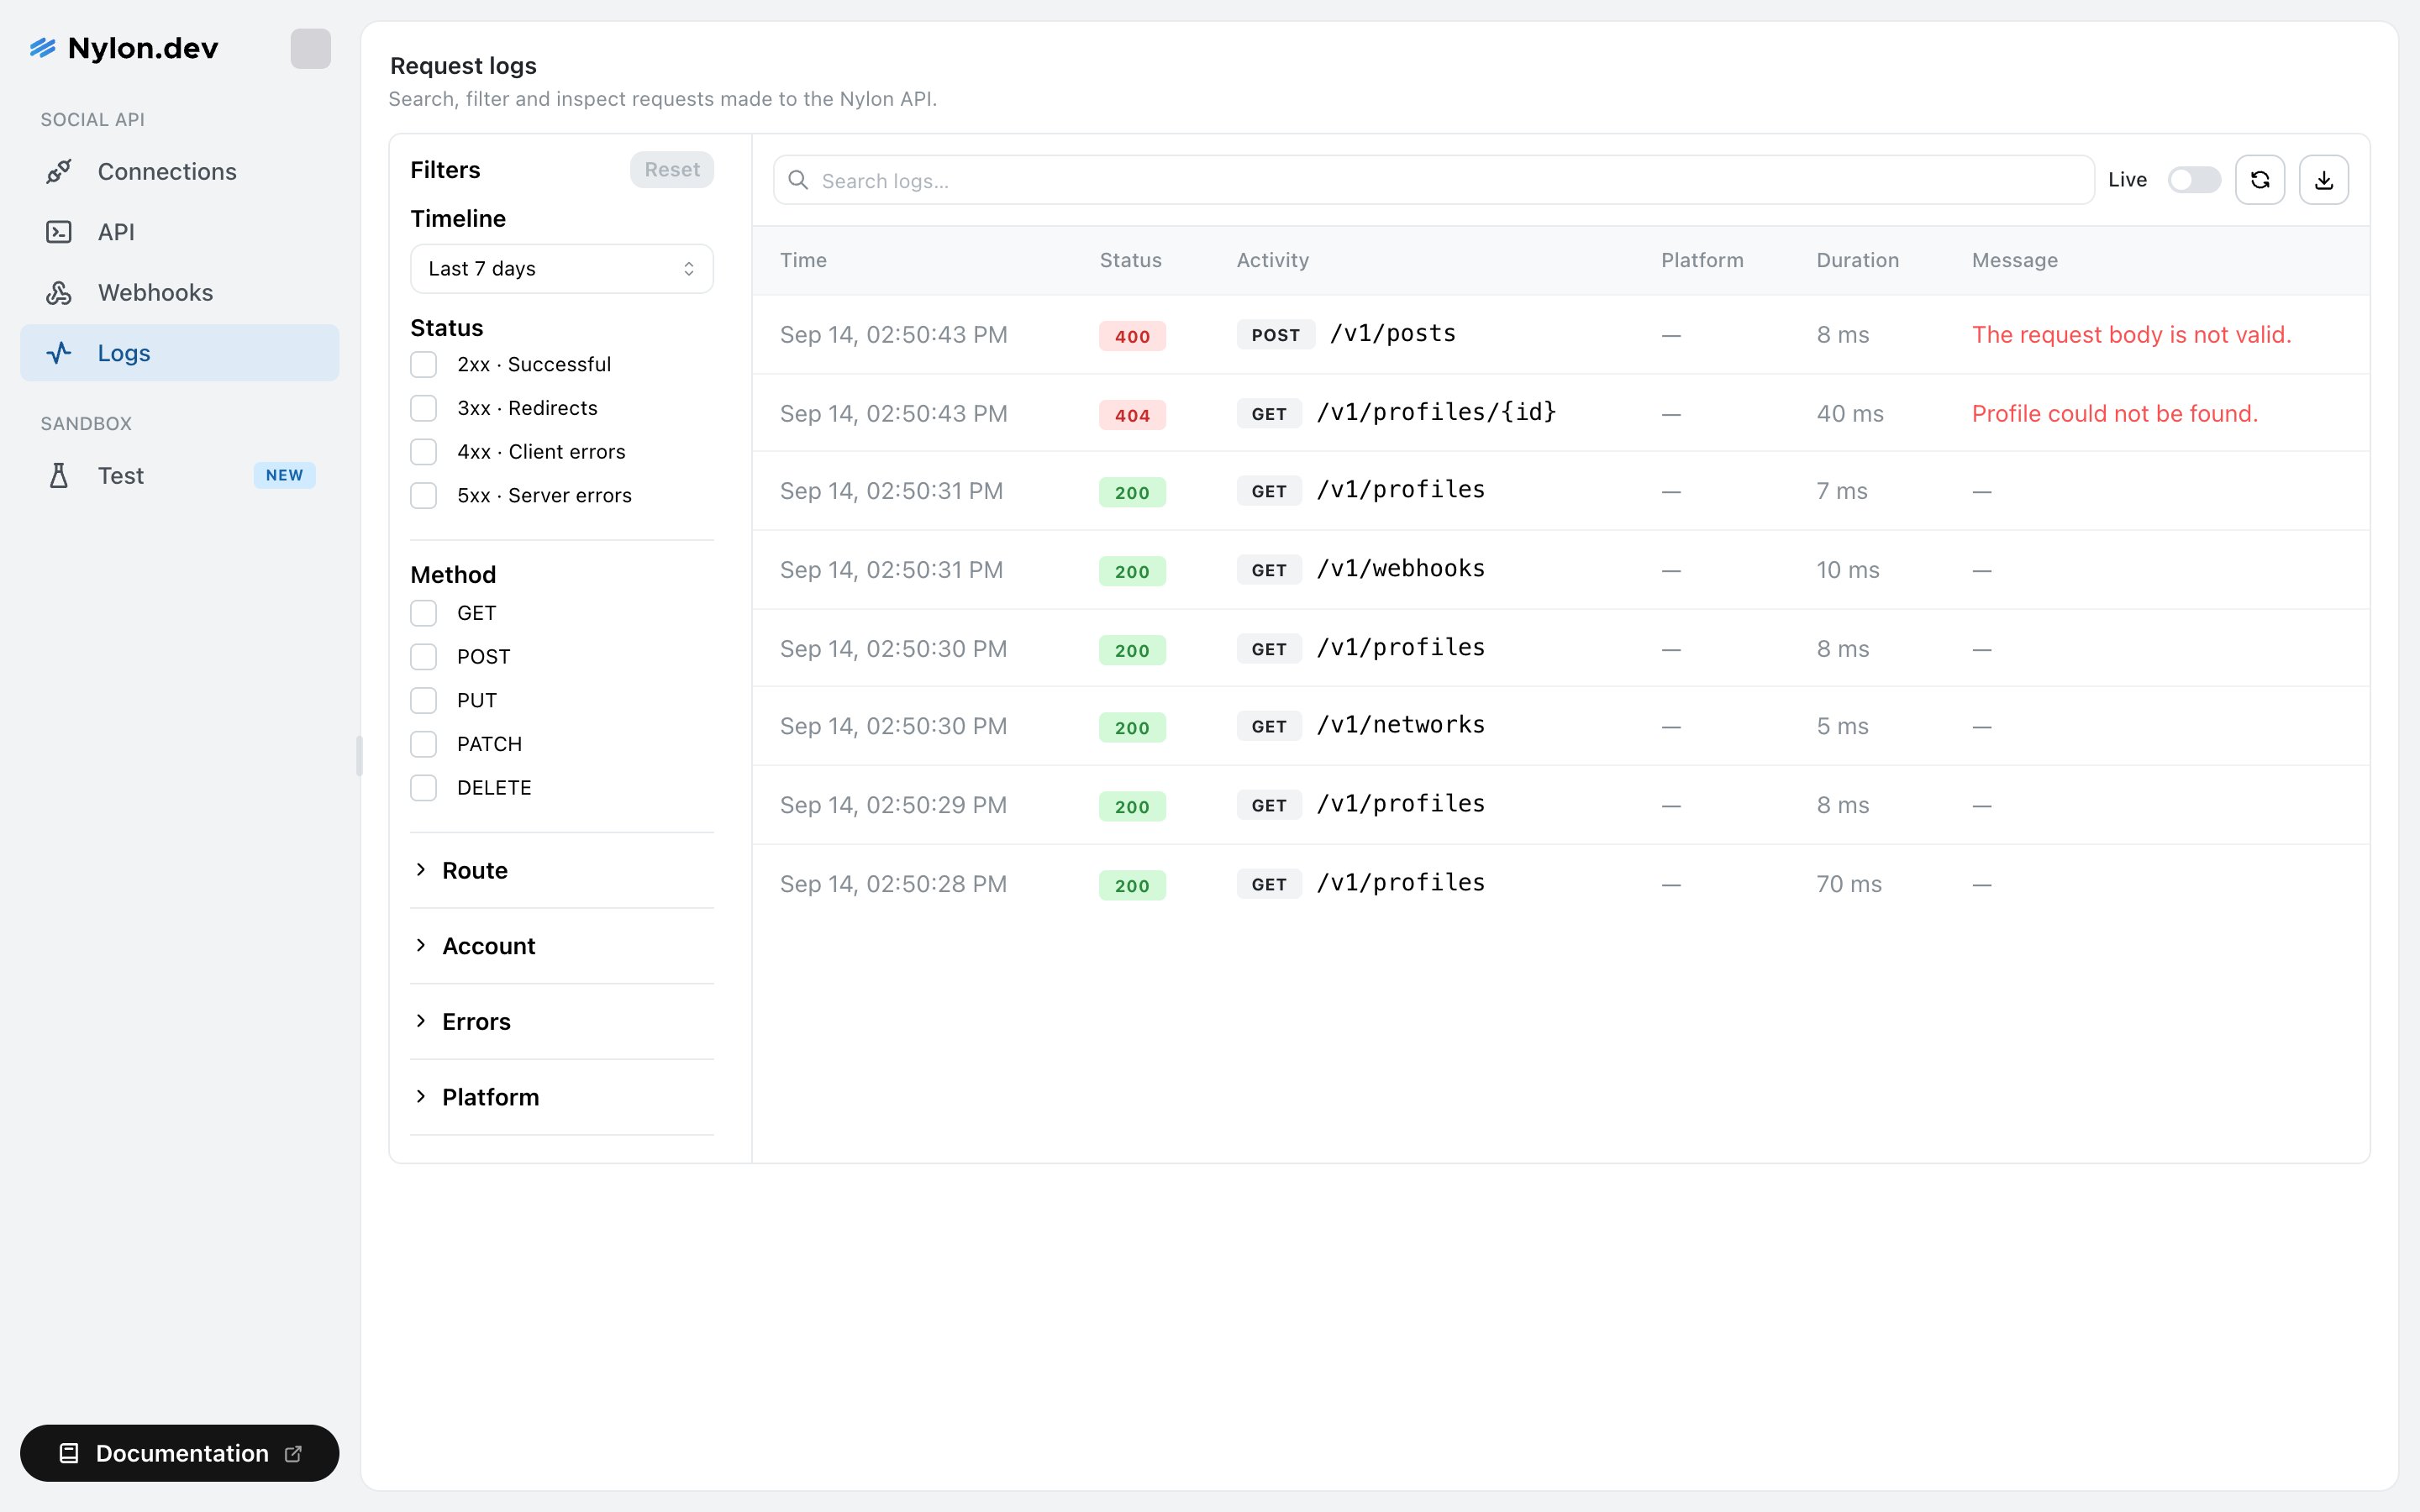
The Logs page, with filters down the left and one row per request.
What a row shows
Select a row to open it. You get the endpoint, the full request body, the full response body, and — where the request concerned a specific account — the platform, the account and the error code.
Filtering
The filter sidebar narrows the list. Timeline is the one that matters most, because it also determines what the other filters can offer: the Account and Errors dropdowns are built from what is actually in the selected range, so widening the range surfaces more options.
Reset clears everything at once. The search box above the table matches across the logged requests as well.
Live mode
The Live switch above the table keeps the list refreshing as requests arrive. Useful while you are running a deploy or testing a new integration; turn it off when you want to read something without it moving.Export
The download icon exports the rows currently on screen as CSV — filters applied. Handy for handing an incident to someone who does not have a Nylon login.Whose requests you see
API keys are owned by the person who created them, and the Logs page shows requests made with your keys. A teammate’s key produces requests in their log view, not yours. If you cannot find a request you know was made, check whether it used a key one of your teammates created.What is redacted
Anything that looks like a credential is redacted before the body is stored. Any field whose name containsauthorization, password, secret, token, api key or credential is replaced with [REDACTED], at every level of a nested body.
Everything else in the body is stored as sent — including post content and media URLs.
Related
Debug a failed request
Working from a red row to a cause.
Errors
The error taxonomy, and what each code means.